The data model
NExtSEEK records an experiment as samples joined by assays. This page walks through that idea one picture at a time.
A sample is one thing with typed metadata
A sample is a record of one thing: a mouse, a piece of tissue, a DNA library, a sequencing file, an analysis result. It has a unique ID (its UID) and a set of metadata fields. Which fields it has depends on its sample type.
Samples are not only physical material. A sequencing file or a clustering result is also a sample, so data is recorded in the same way as the material it came from.
Every sample type belongs to a clade
Every sample has one sample type, such as MUS for a mouse, TIS for tissue or D.SEQ for a sequencing file. The type decides the fields. Sample types are grouped into four clades that follow the life of the data.
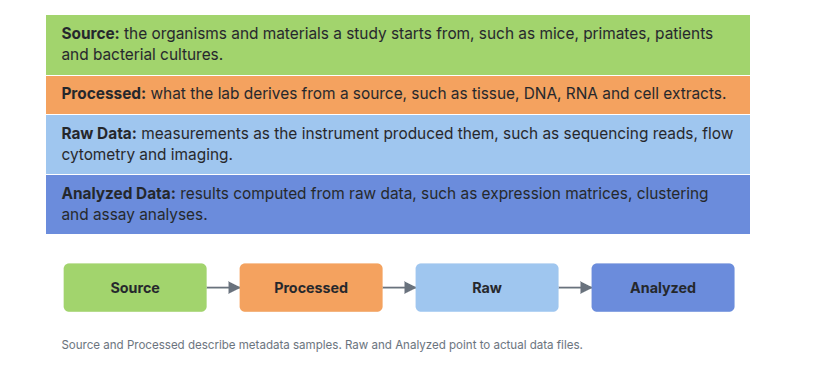
| Clade | What it holds | Examples | Code pattern |
|---|---|---|---|
| Source | The organisms and materials a study starts from | Mouse, non-human primate, patient, bacterial culture, antibody | Plain code, such as MUS |
| Processed | What the lab derives from a source | Tissue, DNA, RNA, cell extract | Plain code, such as TIS |
| Raw | Measurements as the instrument produced them | Sequencing reads, flow cytometry, imaging | Starts with D., such as D.SEQ |
| Analyzed | Results computed from raw data | Expression matrices, clustering, assay analyses | Starts with A., such as A.GEX |
The full list of types, with their fields, is in Sample types.
Samples connect through assays
An assay is an experiment or procedure done on a sample that produces another sample. It is the edge between the two. The protocol is the document that describes how it was done.
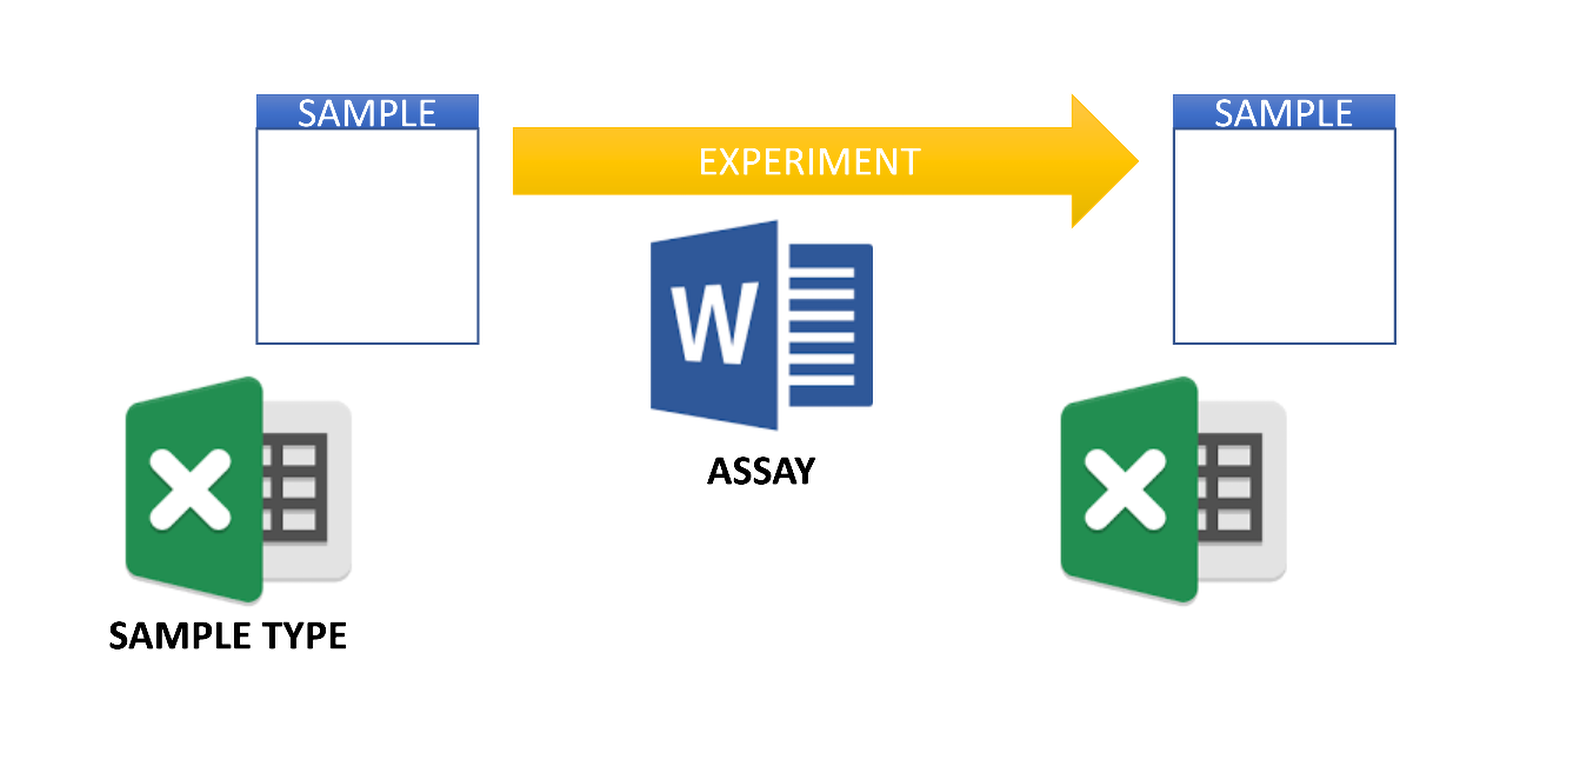
For example, a tissue sample goes through DNA extraction and becomes a DNA sample. The DNA sample goes through sequencing and becomes a sequencing file. Each step is one assay, and each assay names its parent sample and the sample it made. See Assays.
A full experiment
Chain these steps together and you get the whole experiment, with the right metadata recorded at every step.
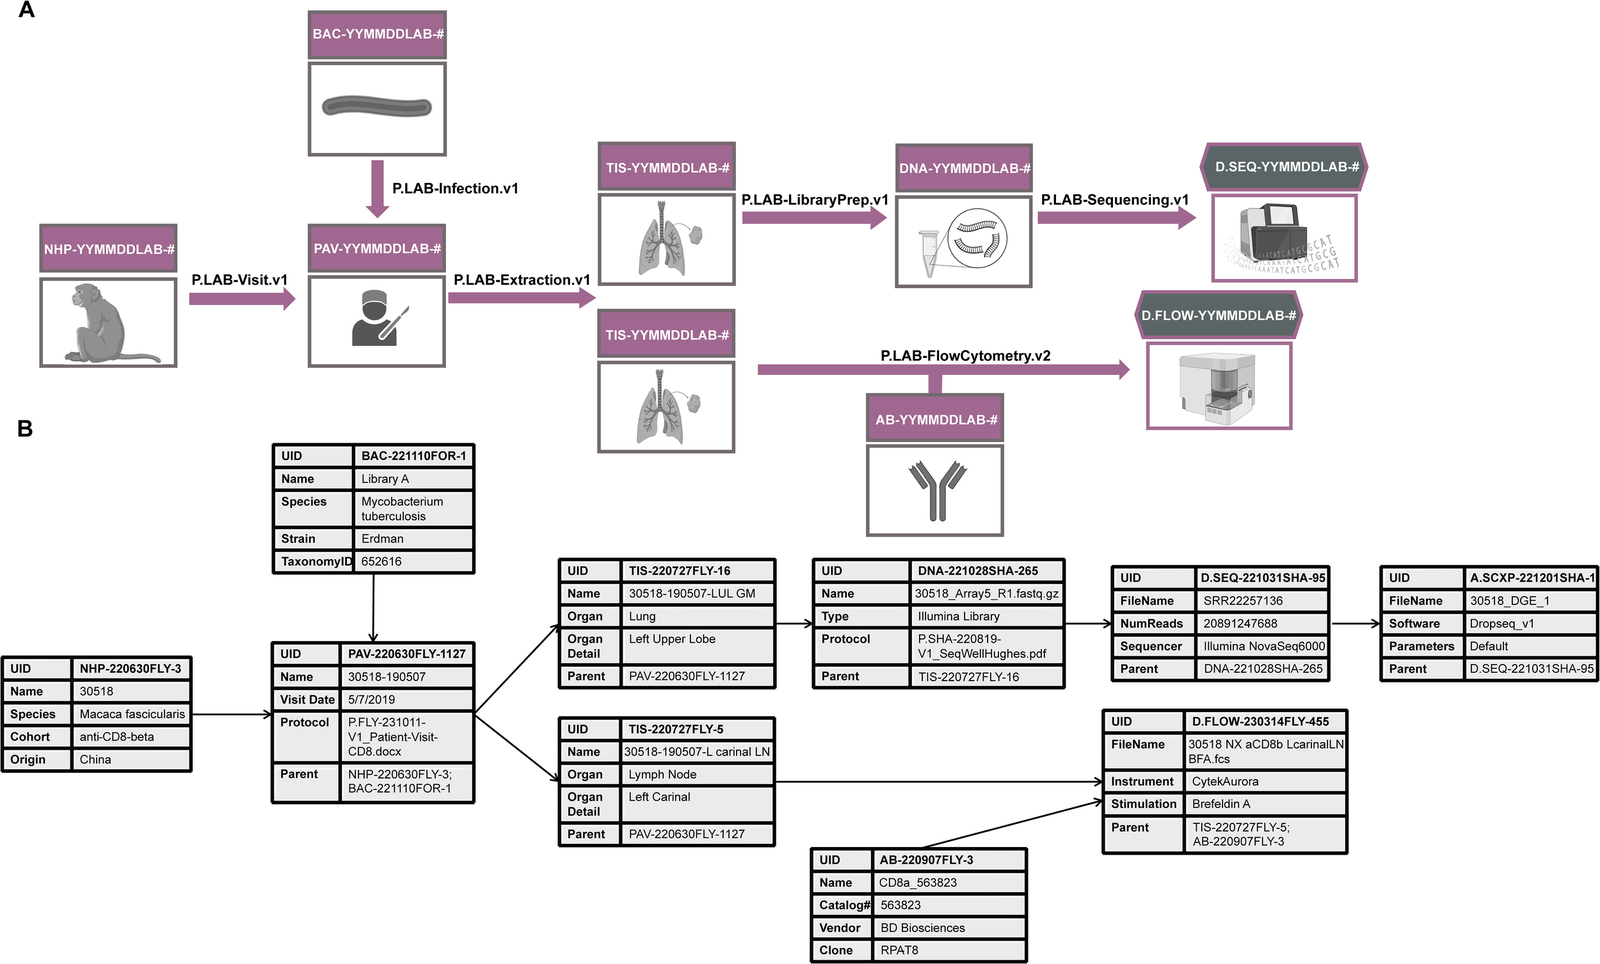
Every table in panel B has a Parent field. That field is how NExtSEEK knows which sample an assay started from.
Every sample has a lineage
Because each sample names its parent, you can walk from any sample up to its source, and down to everything made from it. This is the tree you see on a sample's page.
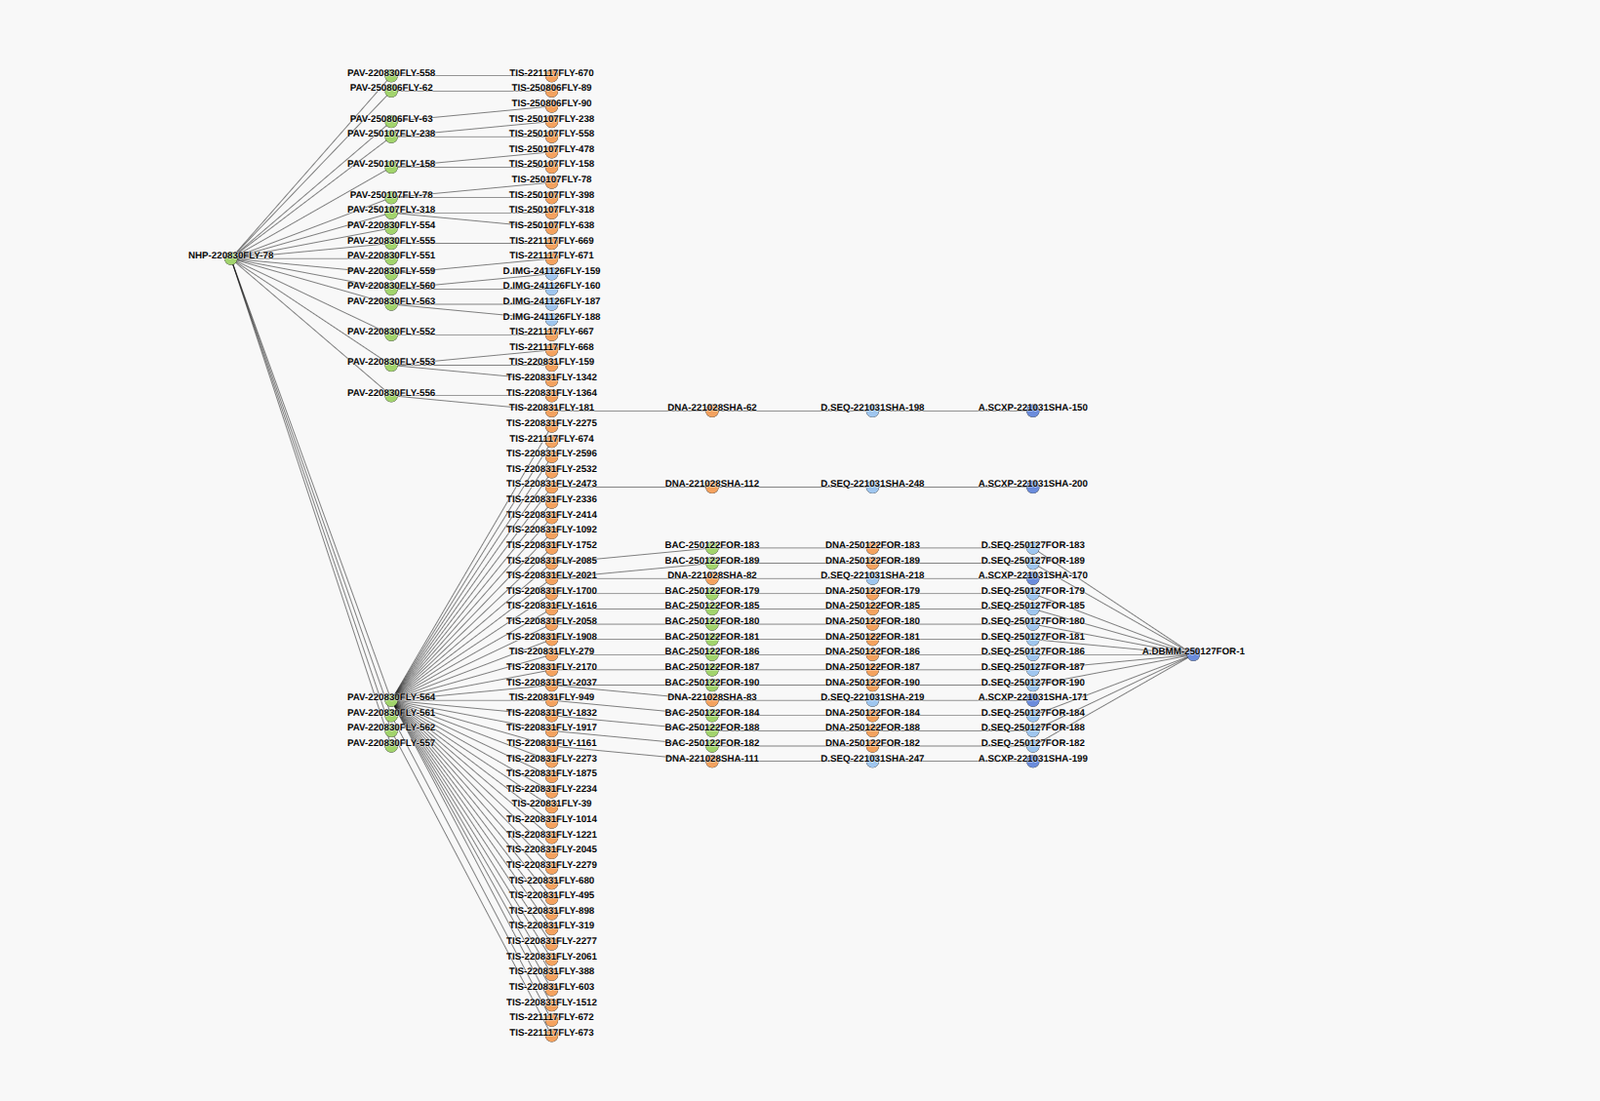
A tree like this can grow large for a long study. You start at any sample and click along the tree to move to its parents or children.
A project's sample types form a graph
The same idea works one level up. Instead of single samples, look at sample types. A project uses a set of types, and assays connect them. Drawn together, they show how work flows through that project.
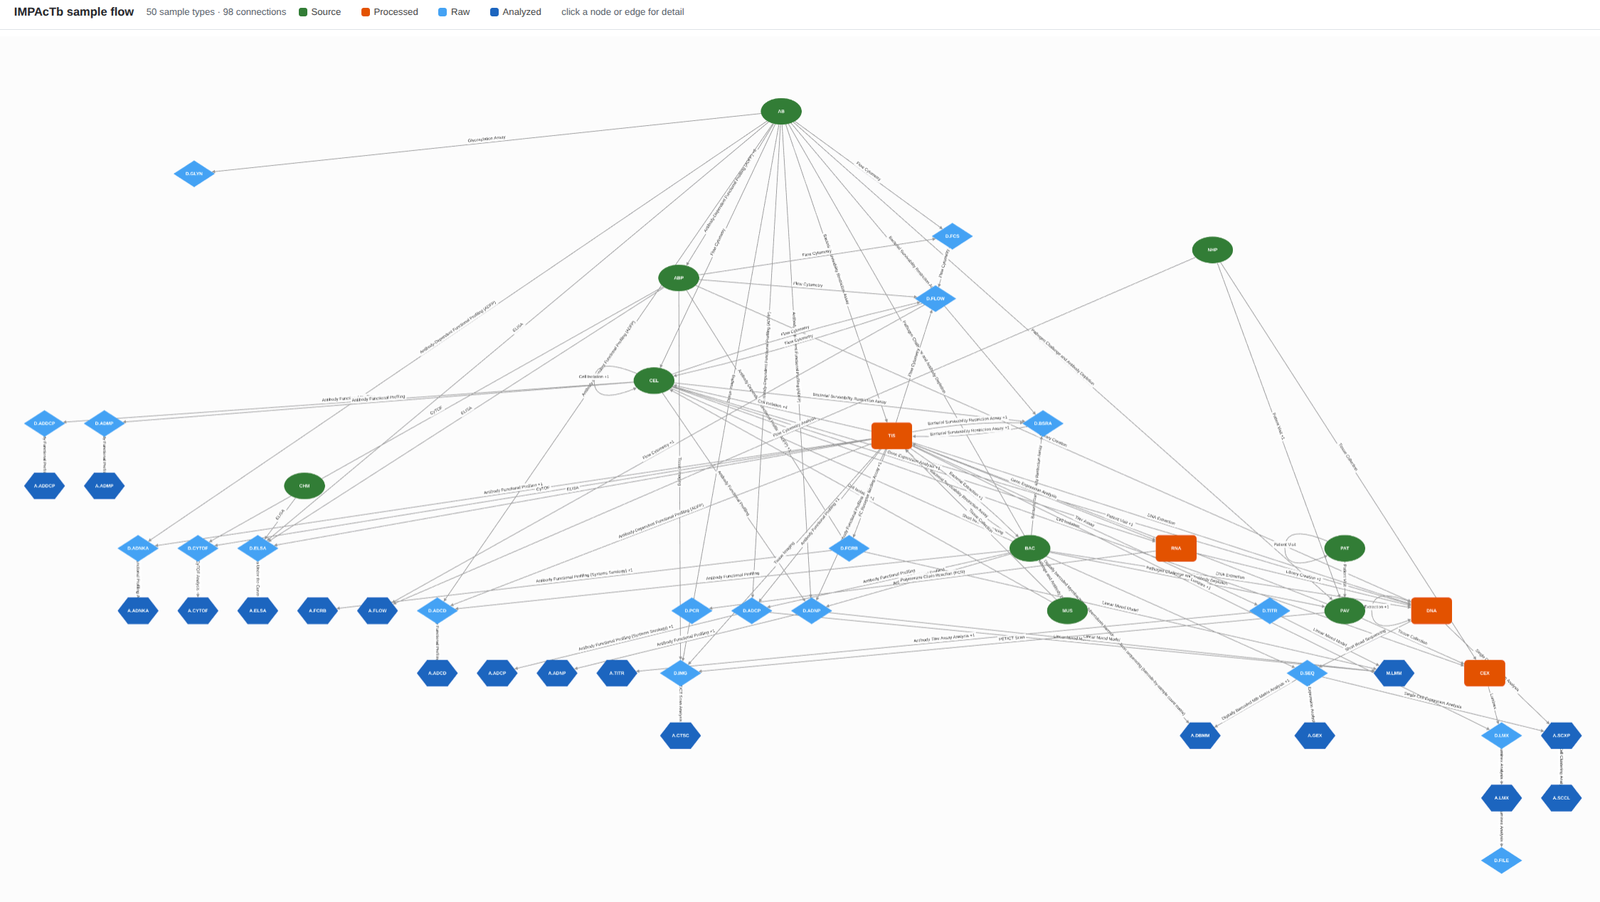
Project pages show this graph as the Sample flow. Click a node or an edge to see its details, or use Fullscreen for a larger view. See Projects and templates.
Where to go next
- Sample types: every type, its clade and its fields.
- Assays: the experiments that link samples.
- Projects and templates: the project page and the upload templates.
- Graph search: search across the connections between samples.